The gold-silver ratio is far more than just a number on a chart, it is one of the most ancient and continuously tracked financial indicators in human history. Originating in the earliest civilizations, this ratio has witnessed the rise and fall of empires, served as the bedrock for monetary systems, and continues to act as a barometer for global investor sentiment today. As markets shift between risk and safety, understanding this relationship is crucial for any savvy investor or industry professional.
This analysis explores the ratio's fascinating history, its dramatic current movements, the forces that drive it, and its real-world impact on everything from investment portfolios to jewelry pricing.
Gold-Silver Ratio -
At its core, the gold-silver ratio is a simple mathematical expression: it tells you exactly how many ounces of silver it takes to buy a single ounce of gold. To calculate it, you simply divide the current price of gold by the current price of silver.
The guiding rule of thumb for the gold-to-silver ratio is the 80-50 rule. Generally speaking, when the gold-to-silver ratio is anywhere between 80:1 and 50:1, the two metals are considered to be reasonably priced. However, when the ratio moves beyond these limits, one metal is considered overpriced and the other underpriced. When the ratio is above 80:1, gold may be overpriced, or silver may be underpriced. Conversely, when the ratio is below 50:1, silver may be overpriced and gold underpriced.
The Historical Evolution of the Ratio -
Ancient Origins:
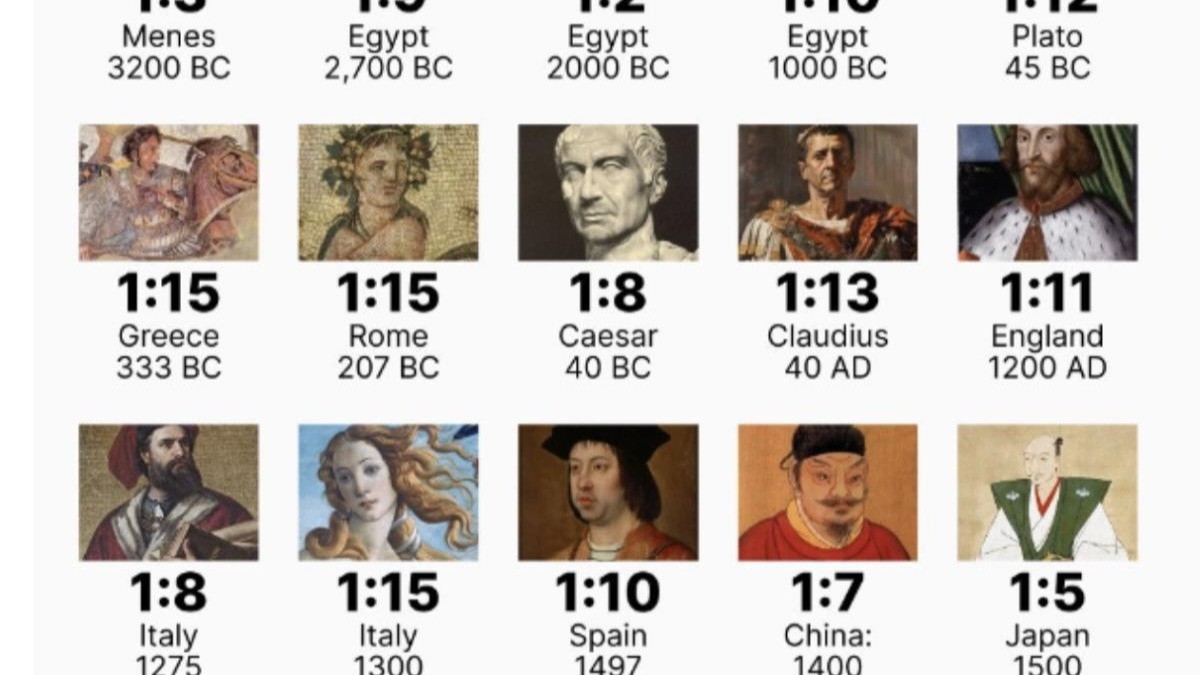
The earliest recorded instance of the gold-silver ratio dates back to 3200 BCE, when Menes, the first king of Ancient Egypt, fixed the value of gold at 2.5 times that of silver. As civilizations became more familiar with the scarcity and difficulty of producing each metal, the ratio generally rose.
The ratio played an essential role in the monetary systems of the ancient world. In Ancient Rome, it was one of the earliest civilizations to set a standard, starting as low as 8:1 in 210 BCE. Due to varying inflows of gold and silver from conquests, the ratio fluctuated between 8 and 12 ounces of silver for every ounce of gold. By 46 BCE, Julius Caesar had established a standard of 11.5:1, a level that was later increased slightly under Emperor Augustus.
The Age of Bimetallism:
For centuries, the ratio was not a free-floating market price but was set by governments to control their currency and coinage. As empires and nations grew, the ratio remained relatively stable. Miners unearthed about eight ounces of silver for every ounce of gold annually, and the metric remained around 15 or lower for many centuries.
A pivotal moment arrived with the U.S. Coinage Act of 1792, which established a fixed ratio of 15:1 for the young nation's bimetallic standard. Around the same time, France enacted a ratio of 15.5:1. These fixed ratios, however, were not to last. The growth of the Industrial Revolution and the volatility of the two World Wars caused massive fluctuations in currencies and metals, with the ratio reaching highs of around 40:1 by the 20th century and nearly 100:1 during World War II.
The Modern Era:
The abandonment of the gold standard and the transition to a global system of fiat currencies in the 1970s introduced a new era of extreme volatility for the gold-silver ratio. Between 1920 and the present, the ratio has fluctuated wildly between 25 and 100, a stark contrast to the relative stability of the previous centuries.
In the modern era, the ratio has experienced dramatic peaks and troughs. It peaked in 1939 at 98:1 after President Franklin D. Roosevelt changed the statutory price of gold from $20.67 to $35 per ounce. In 2020, during the onset of the COVID-19 pandemic, the ratio reached an all-time high of 125.1 as investors sought gold's safe haven. More recently, in August 2025, the ratio hit a staggering 1:88, one of the most extreme levels in recorded history, before beginning to correct.
The Gold-Silver Ratio Today -
The gold-silver ratio has experienced a dramatic shift in early 2026. As of late March 2026, the ratio stands at approximately 65.89, reflecting gold at $4,504 per ounce and silver at $67.80 per ounce. This recent rise follows a period of extreme movement. In late January 2026, the ratio sat at around 46:1, representing a swift and significant 38% shift in just a few months.
This movement is driven by fundamental market forces. The gold-silver ratio tends to rise during periods of economic instability and financial stress, as investors flock to gold as a proven safe haven. The current rise above its 20-year mean of around 70 indicates a shift toward a more risk-averse posture in global markets, where capital preservation becomes a priority.
Deep Dive into the Drivers -
1. Central Bank Gold Buying This is a key advantage for gold that silver lacks. Since 2008, central banks have been net buyers of gold, permanently removing significant supply from the market. This official sector demand provides a consistent, non-market force that supports gold prices. When you net out central bank transactions, gold supply is lower today than it was in 2005, while silver supply is up by over 35%.
2. Technological Change and the Green Energy Transition Technology has been a double-edged sword for silver. In 2000, photography consumed a quarter of the world's silver output. Today, that has dwindled to less than 4%, explaining part of silver's historical underperformance. However, silver is now a critical component in the green energy revolution, with increased applications in batteries and solar panels providing a new and significant source of demand.
3. Cyclical Industrial Demand Unlike gold, which is a monetary and investment asset, the majority of silver demand is industrial. This makes silver highly sensitive to the health of the global economy. During periods of strong growth, industrial demand pushes silver prices higher. During recessions or slowdowns, this demand can evaporate, causing silver to underperform gold sharply.
4. Relative Volatility and the "Silver Beta" Silver is a much smaller market than gold, which amplifies its moves in both directions. This characteristic, known as "high beta," means that when gold rallies, silver often rallies even harder. Conversely, when gold falls, silver typically falls by a greater percentage.
Market Sentiment:
The gold-silver ratio is a powerful indicator of prevailing market sentiment, acting as a clear signal for whether investors are in a "risk-on" or "safety-first" mode.
Lower Ratio (Risk-On): When the ratio is low (e.g., below 50), it signals that silver is outperforming gold. This is typically a "risk-on" environment. Investors are optimistic about economic growth, are willing to take on more risk, and see potential in the industrial demand that drives silver. This dynamic often coincides with strong momentum in lower-cost assets and a general appetite for growth.
Higher Ratio (Safety-First): When the ratio is high (e.g., above 80), it signals that gold is gaining strength and investors are moving toward stability. This is a "safety-first" or risk-averse environment. During periods of economic uncertainty, geopolitical tension, or market turmoil, investors flock to gold's proven role as a store of value and a hedge against instability.
The extreme spike in the ratio during the COVID-19 pandemic, where it reached 125:1, perfectly exemplifies this flight to safety. The recent move in 2026 from a low of 46 in January to near 66 in March signals that the initial euphoria and risk-taking have given way to a more cautious outlook, with investors prioritizing gold's reliability.
Investment Strategies Using the Ratio -
For generations, precious metals investors have used the gold-silver ratio as a tactical tool to enhance returns. The core principle is mean reversion, the idea that when the ratio deviates to an extreme, it will eventually move back toward its long-term average.
The most common strategy is the 80/60 Rule:
When the ratio hits 80:1 or higher, silver is considered relatively cheap. This is a signal to buy silver or trade some gold for silver.
When the ratio falls to 60:1 or lower, gold is considered relatively cheap. This is a signal to shift toward gold or trade silver for gold.
Investors can implement this strategy in several ways:
Physical Allocation: Directly adjust the weighting of gold and silver bullion in a portfolio.
ETF Pair Trading: Buy silver ETFs (like SLV) and sell gold ETFs (like GLD) when the ratio is high, and vice versa.
Futures Contracts: Use gold and silver futures to express a view on the ratio's direction.
The 2025-2026 Swing -
In April 2025, the gold-silver ratio pushed above 100:1, a significant extreme. At that time, silver was trading around $30 per ounce. Investors who recognized the opportunity and increased their silver exposure have since been rewarded, as silver surged to about $48 per ounce, a gain of roughly 60% in just a few months.
By late January 2026, the ratio had plummeted to 46:1, well below the 50 threshold, suggesting gold had become the relatively better value. Since then, the ratio has indeed begun to revert, climbing back toward 66 as gold has started to outperform once again.
Impact on the Jewelry and Diamond Industry -
The dramatic fluctuations in the gold-silver ratio and the absolute prices of these metals have profound implications for the jewelry and diamond industries. These shifts are not just abstract numbers; they directly affect material costs, pricing strategies, and consumer behavior.
Changing Material Choices and Karat Preferences -
Soaring gold prices are forcing jewelers to adapt. As gold becomes more expensive, there is a noticeable industry shift toward lower-karat gold to maintain price points for consumers. For example, jewelers are increasingly using 14-karat gold instead of 18-karat. However, the shift is not universal.
Diamond jewellery, considered a premium product, continues to be predominantly set in 18-karat gold, as the setting is seen as complementary to the diamond's value.
The Gold vs. Diamond Dynamic -
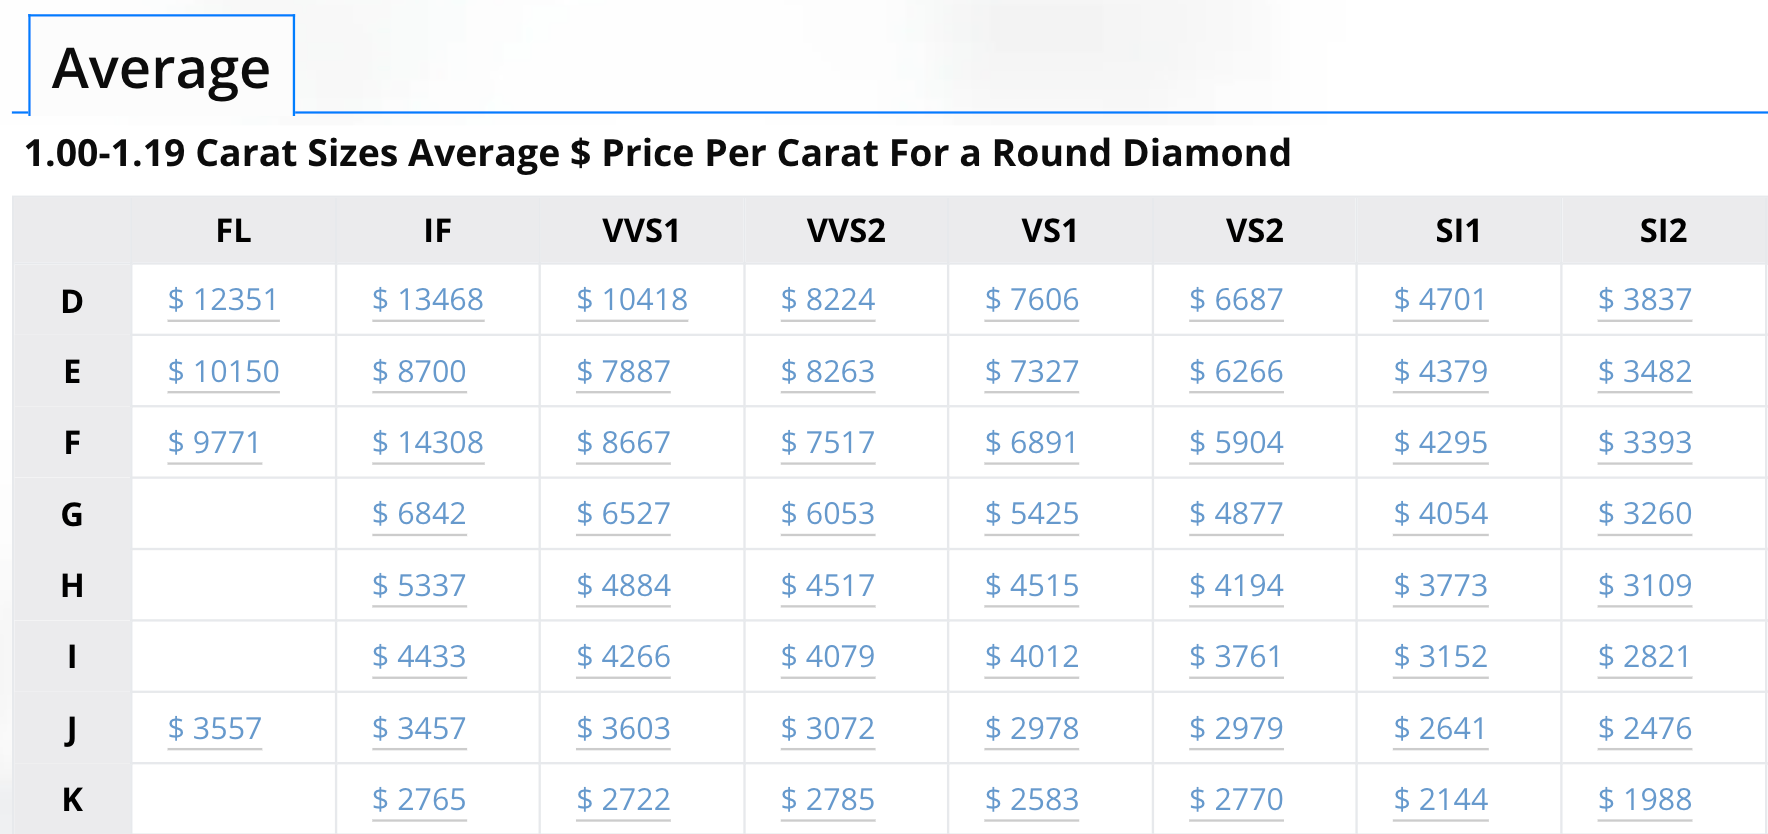
The relationship between gold and diamonds is also evolving. While gold prices have surged, diamond markets have faced their own pressures. In 2025, gold surged 23% while silver climbed 22%, both riding safe-haven demand. In contrast, natural diamond prices, particularly for smaller stones, have declined.
In some cases, gold now accounts for the majority of an engagement ring's price, as loose diamond prices have fallen nearly 40% from 2023 to 2025. This dynamic is creating a "polarizing pattern" in jewelry consumption, where consumers are increasingly favoring gold, while diamonds face challenges.
Adapting to a New Reality -
For jewelers, adapting to this environment requires a multi-faceted approach:
Dynamic Pricing Models: Implementing systems that can adjust prices more frequently to keep pace with volatile metal markets.
Hedging Strategies: Using financial instruments to lock in metal prices for future production runs.
Material Innovation: Exploring alternative metals like platinum, or using silver in more prominent design elements to offset gold costs.
CaratX: Your Gateway to the Global Diamond & Gemstone Market
In a world where the value of precious metals is constantly shifting, having access to a reliable, global marketplace for diamonds and gemstones is more critical than ever. Whether you are a seller looking to expand your reach or a buyer seeking the best value, CaratX provides the platform to navigate these dynamic markets with confidence.
CaratX is designed to connect you directly with opportunities, offering a suite of services to power your business in the international jewelry trade.
For Sellers: Expand Your Business Internationally
For Buyers: Source the World's Finest Materials
By bridging the gap between sellers and buyers on a global scale, CaratX is your partner in turning market volatility into opportunity.
Frequently Asked Questions (FAQs)
Q1: What is the gold-silver ratio in simple terms? A1: The gold-silver ratio is the number of ounces of silver it takes to buy one ounce of gold. For example, a ratio of 65:1 means 65 ounces of silver equal the value of 1 ounce of gold.
Q2: What is the best gold-to-silver ratio for investment? A2: There is no single "best" ratio, but many investors follow the 80/60 rule. They consider buying silver when the ratio is above 80 (silver is cheap) and buying gold when it's below 60 (gold is cheap).
Q3: Why does the gold-silver ratio matter for the jewelry industry? A3: The ratio affects the relative cost of raw materials. When gold is expensive, jewelers may use lower-karat gold, adjust designs to use less metal, or incorporate more silver. The absolute prices of gold and silver also directly impact the final price of jewelry pieces.
Q4: Is the gold-silver ratio a reliable market indicator? A4: Yes, it is considered a reliable indicator of market sentiment. A rising ratio typically signals economic uncertainty and a flight to safety (gold), while a falling ratio suggests confidence and a "risk-on" environment (silver).
Q5: How can I start selling diamonds or jewelry internationally? A5: You can register as a seller on a global marketplace like CaratX. Our platform provides the tools and access to connect you with buyers in over 18 countries. Click here to register and get started.
The gold-silver ratio is not merely a relic of the past but a dynamic, living indicator that continues to shape markets, influence strategies, and define the relationship between the world's most storied precious metals.
Image Credit - The Silver Manifesto